

I. Introduction
II. Materials and Methods
2.1 Experimental set-up
2.2 Acoustic intensity measurement
2.3 HIFU beam path visualization
III. Results and Discussion
IV. Conclusions
I. Introduction
High-Intensity Focused Ultrasound (HIFU) has received increasing interest as a thermal ablation tumor therapy due to its noninvasive and accurate targeting ability.[1],[2],[3] In HIFU treatment, by focusing acoustic energy on specific areas where temperature rises and cavitation is generated, only an abnormal tissue could be locally treated without damaging surrounding healthy tissues.[4],[5],[6] From previous studies, HIFU treatment has shown promising therapeutic effects in different types of tumors, such as uterine leiomyomas, liver tumors, thyroid tumors, renal cell carcinoma, bone metastasis, pancreatic cancers and breast cancers.[7],[8],[9],[10],[11],[12],[13],[14],[15],[16],[17]
In HIFU treatment, as temperature at the HIFU focal site rises higher than 60°C within a few seconds and inertia cavitation generates irregular lesions, effective pre-targeting and monitoring in real time is essential for the patient's safety.[6],[18],[19] Currently, Magnetic Resonance Imaging and ultrasound imaging (i.e., MRIgHIFU and USIgHIFU) are utilized as a guidance and monitoring modality. MRI can localize HIFU focus since it can visualize the ultrasound beam path.[20] In addition, it can show temperature evaluation during HIFU treatment.[21] However, it is difficult to achieve real-time monitoring due to a long image acquisition time.[6],[22] On the other hand, USI has the potential to provide real-time guidance of HIFU treatment at a relatively low cost.[23]
Several groups have investigated targeting and monitoring techniques based on USI. The changes of physical properties (e.g., speed of sound, attenuation coefficient and elastic modulus) of targeted tissues during HIFU treatment have been assessed to localize HIFU lesions.[24],[25],[26],[27],[28] Advantages and disadvantages of each technique were comprehensively summarized elsewhere.[6] Among various USIgHIFU methods, acoustic backscattering and interference-based methods were proposed as a pre-targeting technique to localize HIFU focus with low acoustic intensity.[6],[18] However, unlike MRIgHIFU, there is currently no method to visualize the HIFU beam path for USIgHIFU. The HIFU beam path visualization is important for avoiding any adverse damages in surrounding tissues during HIFU treatment since it can not only localize HIFU focus, but also predict any potential risks from unwanted localized heating by means of refraction and attenuation.[29],[30] Therefore, real-time HIFU beam path visualization is essential for enhancing the efficacy of HIFU treatment, providing more accurate and robust surgical planning.
In this paper, a precise and safe HIFU beam path and focus visualization method based on an ultrasound B-mode imaging is presented. Backscattered signals after HIFU exposure were directly used for generating a HIFU targeting image, in which the HIFU beam path and focus were determined, using coherent beamforming and subsequent echo processing. The proposed method was evaluated with Bovine Serum Albumin (BSA) gel phantoms using a custom-built HIFU treatment system.
II. Materials and Methods
2.1 Experimental set-up
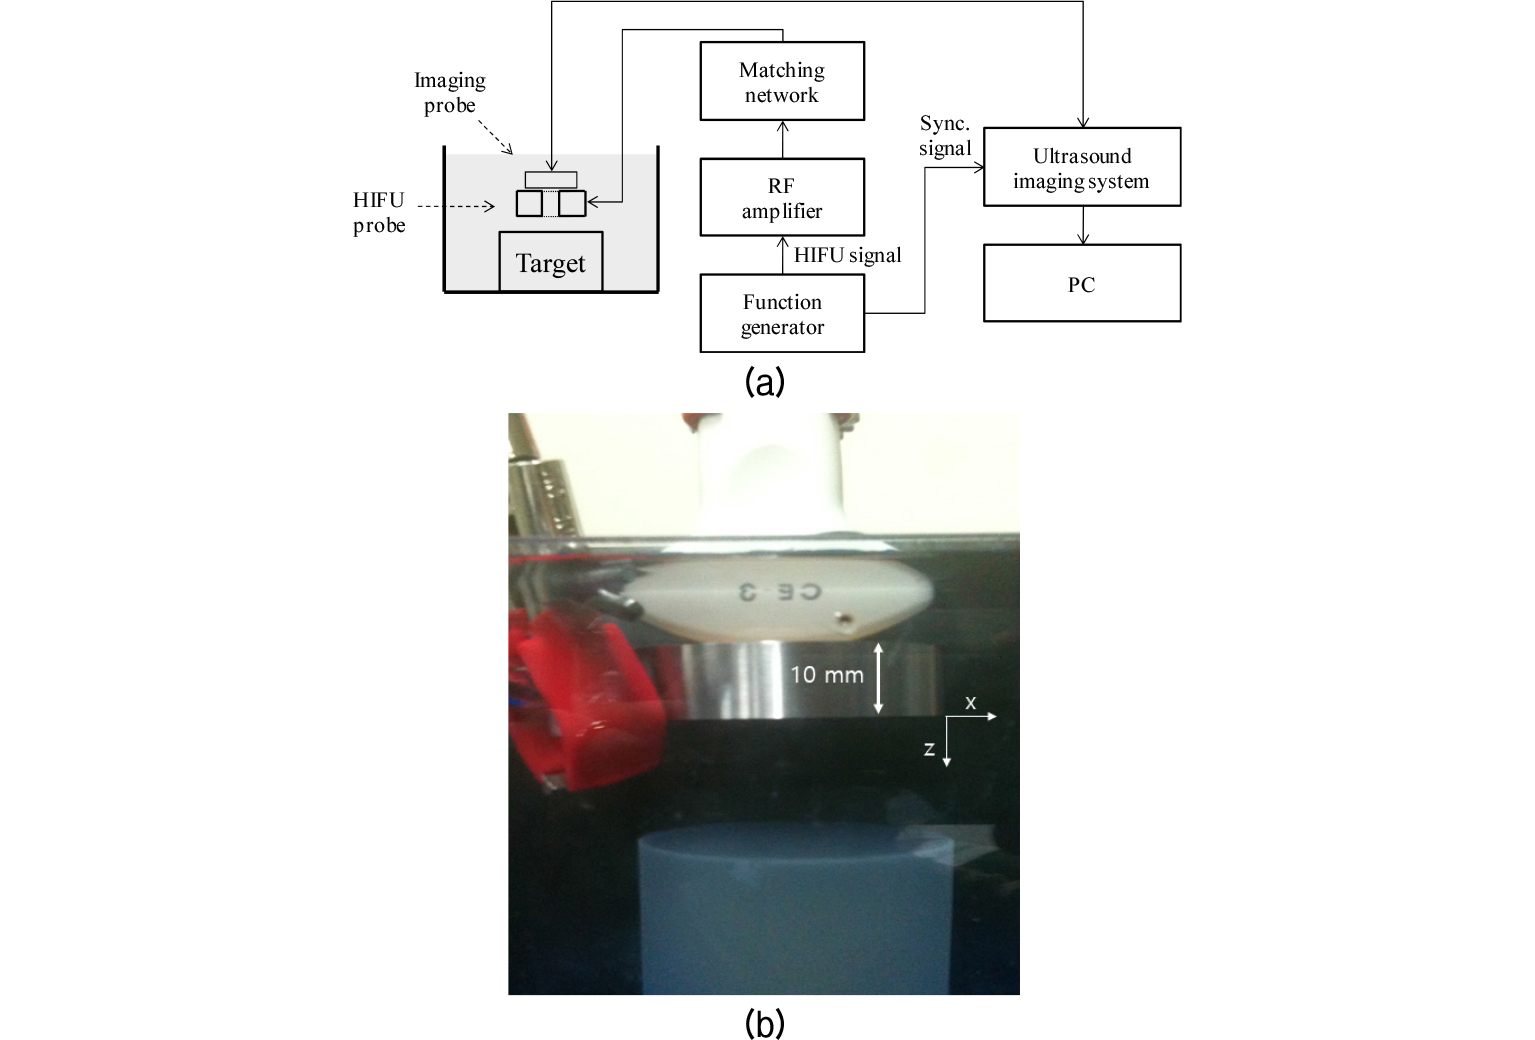
The overall block diagram of the experimental set-up is shown in Fig. 1(a). A single element broad bandwidth HIFU transducer (H-102, Sonic Concepts, Bothell, WA, USA) was used in this experiment. It operated at 1.1 MHz and accommodated a 20 mm central opening for imaging. The geometric focal depth of the HIFU transducer was 62.6 mm. A function generator (AFG3252, Tektronix Inc., Beaverton, OR, USA) generated the HIFU driving signal for targeting and lesion formation. As shown in Fig. 1(a), this signal was amplified by a radio-frequency (RF) power amplifier (75A250A, Amplifier Research Corp., Souderton, PA, USA) and transmitted to a target in the water tank through the supplied RF impedance matching network, resonating at the fundamental resonance near 1.1 MHz. The water tank contained degassed water, which was prepared by boiling tap water and subsequently cooling it to room temperature.[18] A commercial research ultrasound imaging system platform (SonixTOUCH, Ultrasonix Medical Corp., Richmond, BC, Canada) synchronized at each HIFU exposure was used for acquiring received backscattered HIFU signals from BSA gel phantoms containing agar particles as scatterers.[31] The weight/volume (w/v) concentrations of BSA and agar particles were 5 % and 0.4 %, respectively. A curved linear C5-2 probe was used for receiving backscattered signals, operating at a center frequency of 3.3 MHz and a frequency bandwidth of 2 MHz to 5 MHz. The setup for HIFU and imaging probes is shown in Fig. 1(b). All post-beamformed RF data were recorded in the internal memory of the SonixTOUCH research platform and then transferred to a PC for further processing to generate a HIFU beam path image.
2.2 Acoustic intensity measurement
Acoustic intensity during pre-targeting was measured for validating the safety of the proposed method. An Acoustic Intensity Measurement System (AIMS, Onda Corporation, Sunnyvale, CA, USA) with 6 axes and a capsule hydrophone (HGL-0200, Onda Corporation, Sunnyvale, CA, USA) were used for the measurement. The HIFU transducer and the hydrophone were aligned manually because the AIMS software did not work for the H-102 HIFU transducer due to its double peak outside the focal depth.
After the alignment, the hydrophone was moved laterally from -10 mm to 10 mm and axially from 40 mm to 90 mm with 0.5 mm spacing, respectively. At each position, pre-targeting signals were transmitted and then received by the hydrophone. By repeating this process five times, temporal average intensity was measured on a XZ plane from which spatial peak temporal average intensity (Ispta) was derived.
2.3 HIFU beam path visualization
Pre-targeting and HIFU treatment experiments were conducted sequentially. After the HIFU focus was predicted with low acoustic intensity from a beam path image, a HIFU lesion was generated by increasing the HIFU output. To evaluate the performance of the proposed pre-targeting method, the location of the predicted HIFU focus was compared with a lesion from HIFU treatment. Due to the different purposes of pre-targeting and therapy experiments, as listed in Table 1, different experiment parameters were used.
Table 1. Parameters used in the in vitro experiment.
Before pre-targeting, a reference ultrasound image of target areas was obtained without HIFU exposure. In the pre-targeting phase, the acoustic intensity of transmitted HIFU signals was decreased sufficiently so as to not damage targeting areas. The center frequency of the HIFU probe was set to be the same as that of an imaging probe (i.e., 3.3 MHz) and the pulse duration was set to 1.5 s (i.e., 5 cycles) for preserving spatial resolution. The pulse excitation of the SonixTOUCH platform was turned off (i.e., the imaging probe was turned off) and each HIFU exposure was synchronized with the scanline onset timing. All backscattered signals were beamformed and written to the internal memory of the SonixTOUCH platform. Then, beamformed signals were processed with a custom echo processing module running on MATLAB (Mathworks Inc., Natick, MA, USA). After echo processing, the HIFU beam path image was generated and the HIFU focus was identified as the crossing area in the HIFU beam path.
In the HIFU treatment phase, HIFU exposure conditions were changed as listed in Table 1. The output power of a HIFU probe was increased with the pulse repetition frequency at 5 Hz and the duty cycle at 80 %. The excitation frequency was set to 1.1 MHz, which was the resonance frequency of the HIFU probe. Since it was difficult to measure the acoustic intensity of the HIFU output for the treatment phase, the amplitude of the driving signal and the gain of the RF power amplifier were determined empirically. To monitor a lesion formation process with minimal HIFU interference, the modified HIFU real-time visualization method with time sharing was applied.[8] In this time sharing HIFU monitoring method, HIFU excitation was synchronized with the imaging frame onset and delayed by 13 ms to localize the HIFU interference area out of the Region Of Interest (ROI). The HIFU lesion was formed with a HIFU exposure time of approximately 120 s and an ultrasound image including the formed lesion was captured. Finally, the lesion location was compared with the predicted one in order to verify the accuracy of the proposed method.
III. Results and Discussion
As shown in Fig. 2, the BSA gel phantom was placed about 45 mm away from the US transducer and showed homogeneous backscattering. Parallel lines between 30 mm and 40 mm were considered reverberation patterns. Due to the HIFU transducer's small opening for imaging, interference patterns were formed at the left and right side of the phantom. The Dynamic Range (DR) was set to 80 dB.
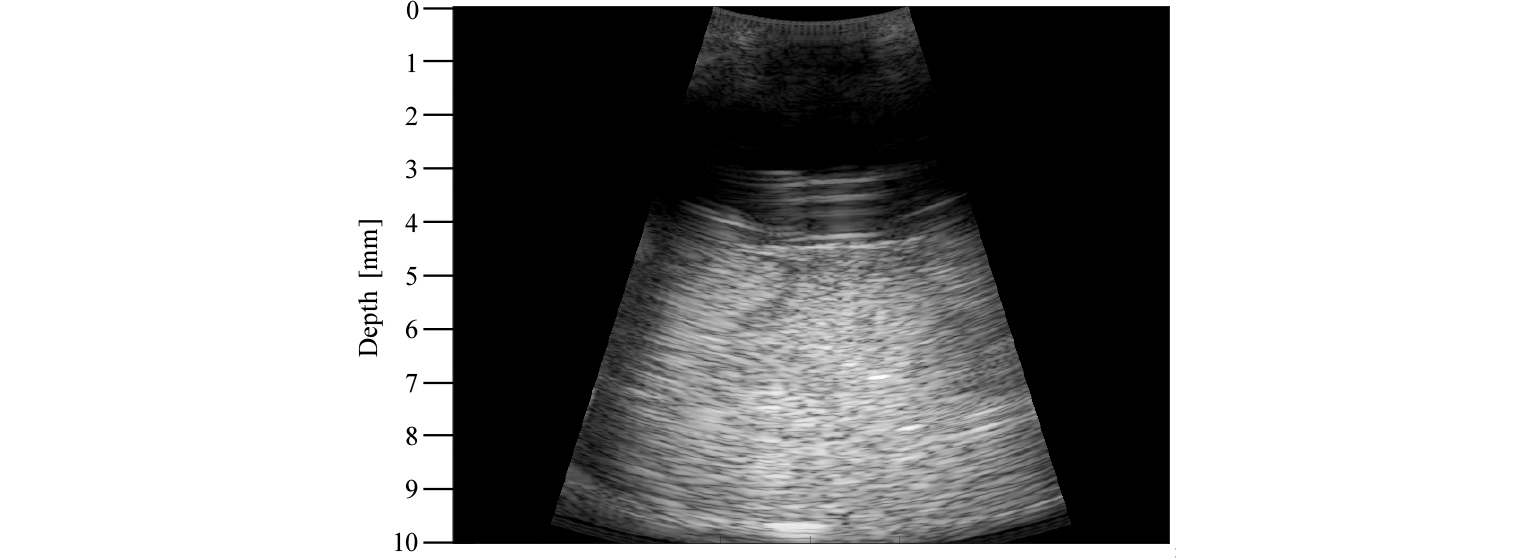
Fig. 3(a) shows the obtained HIFU beam path image before the optimization of the imaging parameters, such that the HIFU beam path is not clearly depicted.
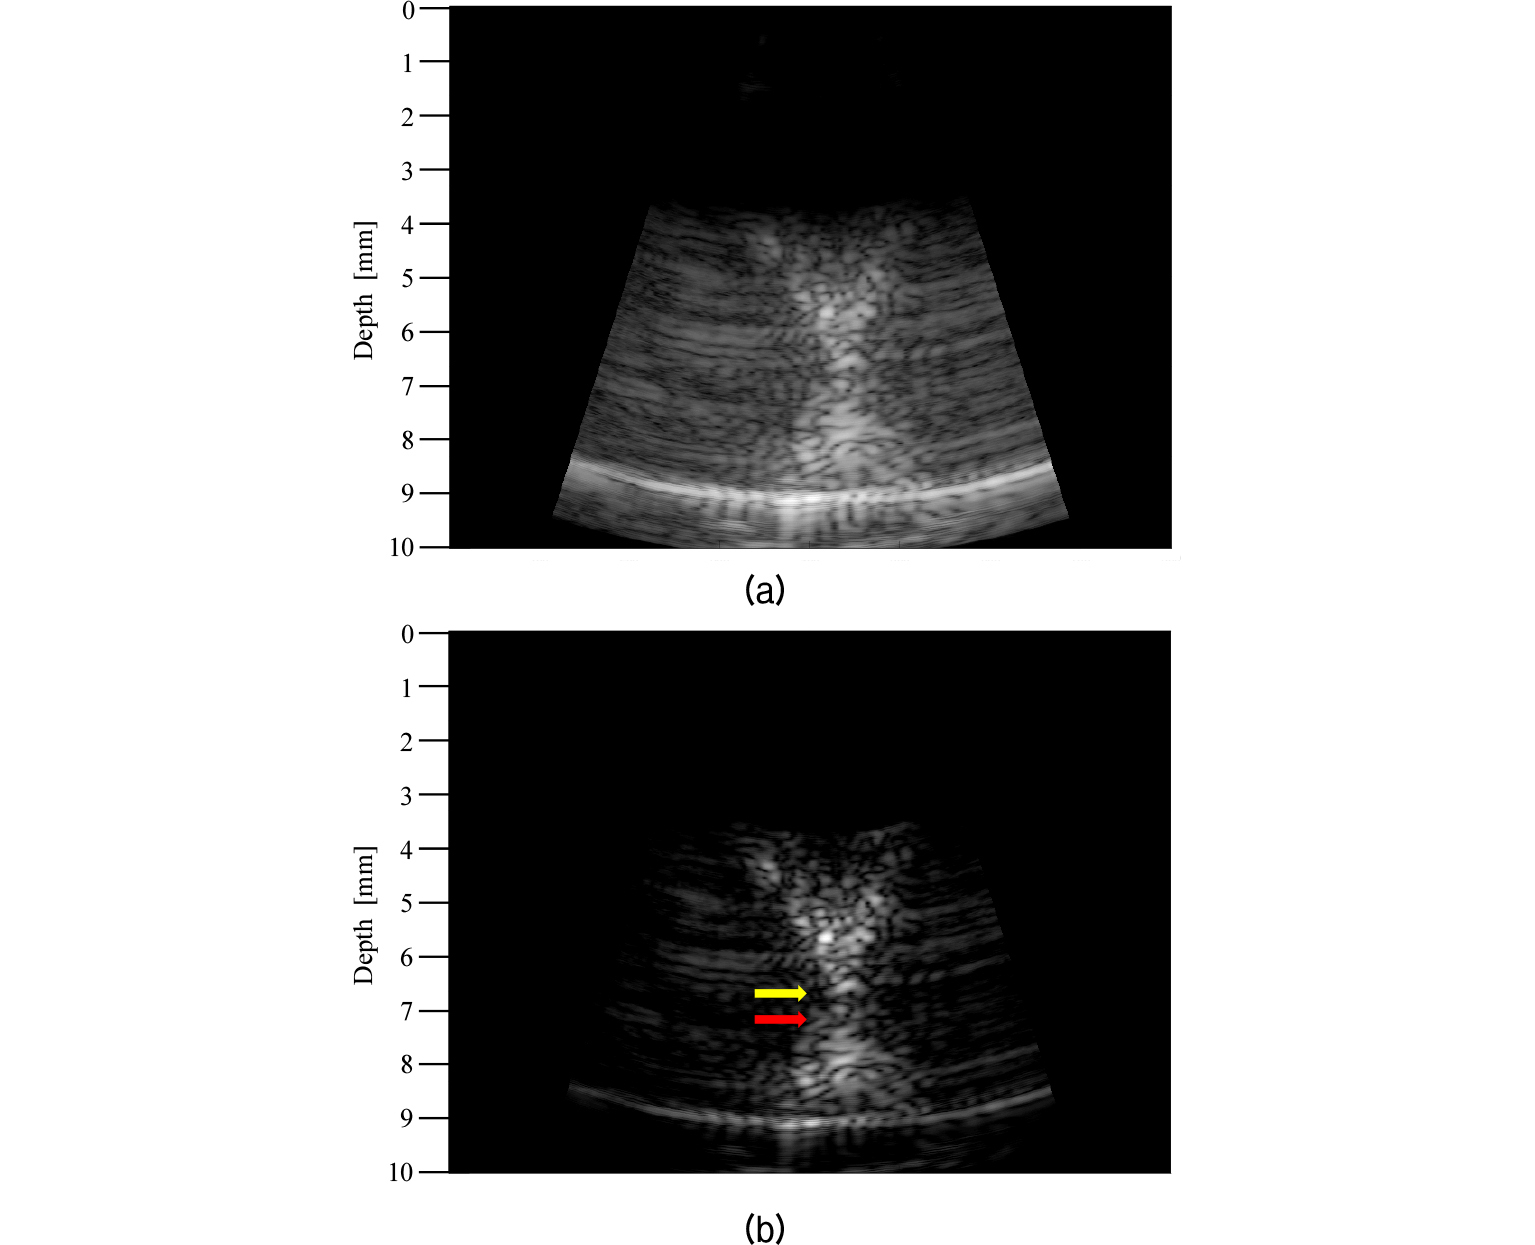
To enhance the HIFU beam path, the Time Gain Compensation (TGC), gain and DR were properly set, as shown in Fig. 3(b).
The TGC was controlled to show homogeneous echogenicity in the HIFU beam path image and the gain value was lowered in order to suppress background noise. Similarly, the DR value was changed from 80 dB to 45 dB to make the beam path distinct from the background. As shown in Fig. 3(b), the shape of the beam path appeared as an ‘× ’ because acoustic energy could not be emitted from the central area of the HIFU transducer due to its opening for imaging. During the pre-targeting phase, HIFU lesions, which can be easily recognized in the transparent BSA gel phantom, did not form.
The crossing point of the beam path (at 67 mm), indicated by a yellow arrow in Fig. 3(b), can be considered as the HIFU focus since maximum scattering occurs at the focus of the HIFU transducer.
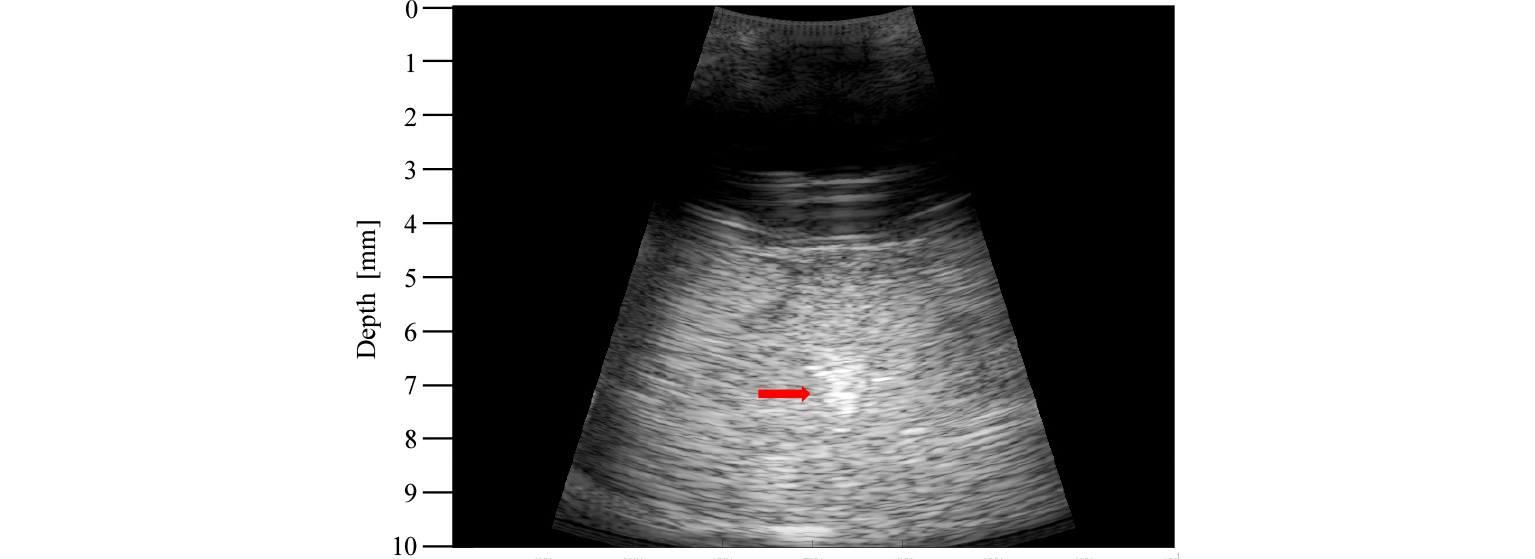
Fig. 4 shows the ultrasound image of the BSA phantom after the HIFU lesion formation. The image was produced by transmitting a short excitation pulse via an imaging probe. As indicated by the red arrow in Fig. 4, the center of the HIFU lesion was located around 72 mm. The yellow and red arrows were plotted together in Fig. 3(b) to compare the predicted HIFU lesion to the actual one. As shown in Fig. 3(b), the distance between the predicted and actual HIFU lesions was 5 mm. This difference occurred because of the gap [10 mm as shown in Fig. 1(b)] between the HIFU and imaging probe. During the pre-targeting phase, the HIFU signal traveled 10 mm less than the imaging signal such that the predicted lesion, as shown in Fig. 3(b), was actually 5 mm closer to the imaging probe when considering a round trip time. The formed HIFU lesion was easily recognizable in the BSA gel phantom, as shown in the photographs of Fig. 5.
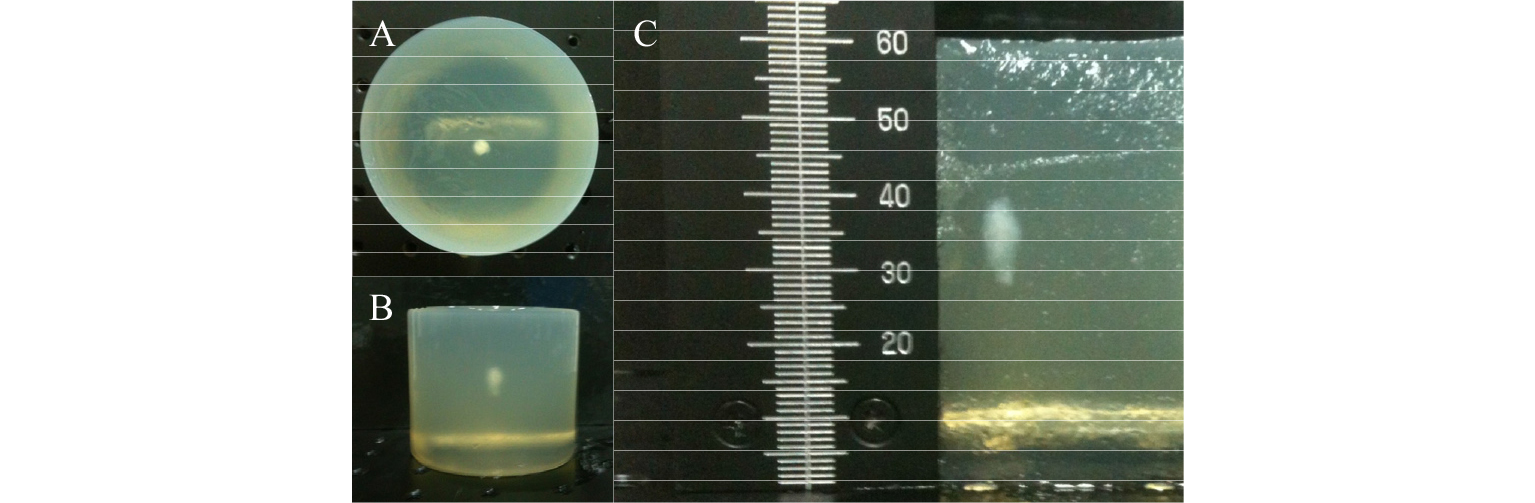
For further assessment, the cross-sectional view of the BSA gel phantom is shown in Fig. 5(c). The HIFU lesion formed at approximately 25 mm below the surface of the BSA gel phantom, which was located at around 45 mm from the surface of the HIFU probe. Therefore, HIFU lesion was at approximately 70 mm from the HIFU probe, close to the estimated location of 72 mm. The difference of 2 mm occurred because the location was measured based on the center of the lesion while HIFU lesions were growing toward the HIFU probe.[32] Fig. 6 shows a measured HIFU beam profile during the pre-targeting phase. The beam profile is similar to the HIFU beam path shown in Fig. 3. The focal depth from the measurement was 65.0 mm compared to the 62.6 mm from the data sheet. The discrepancy of 2.4 mm can be attributed to measurement errors. From the HIFU beam profile, the derated Ispta, was measured as 94.8 mW/cm2 while the regulated value by the Food and Drug Administration is 720 mW/cm2.

The HIFU beam path visualization technique using an ultrasound B-mode imaging with low acoustic intensity was proposed.
For pre-targeting, a short pulse with a center frequency of 3.3 MHz was excited via a HIFU probe while turning off the emission from an ultrasound imaging probe. Consequently, backscattered signals were received using the imaging probe. When a 1.1 MHz center frequency pulse is used as a HIFU excitation signal, the 3rd harmonic component of received signals, which is matched to the center frequency of the imaging probe, can be used for pre-targeting. However, to generate the 3rd harmonic signal, an increased acoustic intensity is required. Thus, it is necessary for HIFU pre-targeting to use an elevated frequency pulse (e.g., 3.3 MHz) when safety is concerned. Although the HIFU beam path can be successfully visualized on a B-mode ultrasound image, further investigations are required for confirming its accuracy and robustness. All pre-beamformed RF signals should be captured and then received beamforming needs to account for the gap between the HIFU and imaging probes. It must be noted that no study has shown a HIFU-induced beam path with low acoustic intensity using an ultrasound imaging system.
The HIFU treatment can be more safely guided with beam path information than when only guided with focus location. For example, the effect of acoustic obstacles, such as bones, can be easily recognized in a HIFU beam path image even though they are not shown on normal ultrasound imaging due to the different geometries of HIFU and imaging probes. When treating targets near bones, the HIFU treatment process should be guided carefully due to a bone's higher absorption when compared to normal tissues. With the known HIFU beam path and tissue absorption coefficients, the relative energy deposition ratio between the target and the obstacles (e.g., bone) can be estimated. If a HIFU array probe is available, the quality of HIFU focus can be estimated with low acoustic intensity and optimized by varying the transmit delays. Therefore, the real-time feedback from the beam path visualization can considerably enhance the efficacy of the HIFU treatment by optimizing its sonification parameters.
IV. Conclusions
In this paper, a HIFU beam path visualization method using conventional ultrasound B-mode imaging has been presented. From in vitro experiments, the proposed beam visualization method successfully localized the HIFU focus with low acoustic intensity and it was confirmed with the visual assessment of the formed HIFU lesion. This result indicates that the proposed HIFU beam path visualization method can enhance the efficacy of the ultrasound guided HIFU treatment while preventing adverse effects. Further validation with in vitro experiments concerning tissue samples and with in vivo experiments is required for clinical uses.
